Our design team at Onething Design strives to be both human-centered and data-driven. We could spend endless hours poring over data from Google Analytics, but we need a better way to track how people are finding us and interacting with our products. If we had something tailored to our team’s data needs, we could save a lot of time, confusion, and maybe even some tears. Working in a large design agency across multiple brands is never easy when data about user behaviour is easily shared within teams but not shared with others. Here’s where UX data dashboards came in handy for us—and they can do the same for your design teams.
- Briefly explain what a UX data dashboard is and its benefits for design teams.
To begin, let’s clarify what a UX data dashboard is and why it can revolutionize design teams’ workflows. To put it simply, a UX data dashboard is your design control center, where all the key user experience metrics and insights are arranged and presented in a clean and organized manner. Consider it your one-stop resource for learning about how users engage with your designs. Imagine now that all of that important information was at your fingertips, available to guide each and every design choice you made. It’s pretty powerful stuff, isn’t it?
-They amalgamate multiple data sources to give us a clearer picture of what’s going on
-They visualize data so we can sense the dynamics between different things
-They are typically quite efficient representations of systems which helps to manage things
- Highlight the importance of clear data visualization for design decision-making.
The real magic, though, lies in the ability to interpret this massive amount of data and transform it into insights that can be put to use. And that’s where the use of lucid data visualization becomes useful. When intricate information is presented in a clear, aesthetically pleasing way, design teams are better able to quickly see the big picture and confidently make decisions.
This describes the detailed steps we took to create our dashboard.
Define Your Goals and Data Needs
To start, we determined the main information points that our team must monitor as well as the aims and objectives. What typical queries come up when a new design project is starting? This first step encourages team participation and feedback in addition to helping identify the necessary data. Recall that it’s acceptable if not every query is answered in our UX data dashboard’s initial version.
Step-by-Step Process for Defining Goals
Team Brainstorming Sessions: We held brainstorming sessions with our design team to identify the key metrics and questions that we needed answers to. Questions like “What are the most critical user interactions we need to track?” and “Which data points will help us understand user behavior better?” guided our discussions.
User Feedback and Pain Points: We reviewed feedback from our users and identified common pain points and areas where user experience needed improvement. This helped us prioritize the data points that would be most useful.
Project Requirements Analysis: We analyzed the requirements of our current and upcoming projects to determine which metrics would be most beneficial. For instance, if a project focused on increasing user engagement, we prioritized metrics related to session duration and interaction rates.
Setting Clear Objectives: We established clear, measurable objectives for what we wanted to achieve with the dashboard. Objectives like “Reduce user drop-off by 10%” or “Increase conversion rates by 15%” helped us stay focused.
Stakeholder Input: We sought input from other stakeholders, including product managers, engineers, and marketing teams, to ensure that our goals aligned with the overall business objectives and that we captured data that was valuable across departments.
Prioritization and Feasibility Check: Finally, we prioritized our goals based on their importance and feasibility. This step ensured that we didn’t overwhelm our dashboard with too much information and kept it focused on the most critical insights.
A prime example to give here; one of our main goals was to understand user drop-off points in our product funnels. By identifying and tracking these points, we aimed to implement design changes that would improve user retention and overall user experience.
Benefits of This Approach
Focused Insights: By defining clear goals, we ensured that our dashboard provided focused and actionable insights, rather than overwhelming our team with irrelevant data.
Team Alignment: This process fostered collaboration and alignment within our team, as everyone had a shared understanding of what we were trying to achieve.
Iterative Improvement: Setting goals allowed us to continuously iterate on our dashboard, adding new metrics and refining existing ones based on evolving needs and feedback.
Research
After formulating our questions, we looked into the best places and methods for obtaining the relevant information. Here, coordination with the engineering, data, and product management teams was essential. In certain cases, gaps in the data we had initially gathered forced us to modify our original questions.
Pick a Medium
For the purpose of developing our UX data dashboard, we selected the best medium. Although there isn’t a single solution that works for everyone, it’s critical to choose something that works well with the tools and procedures we already have. We chose Google Data Studio because it integrates well with both our data warehouse and Google Analytics. For easy access, we’ve also included links to our qualitative studies.
Google Data Studio / Looker Studio
Investigate and Test
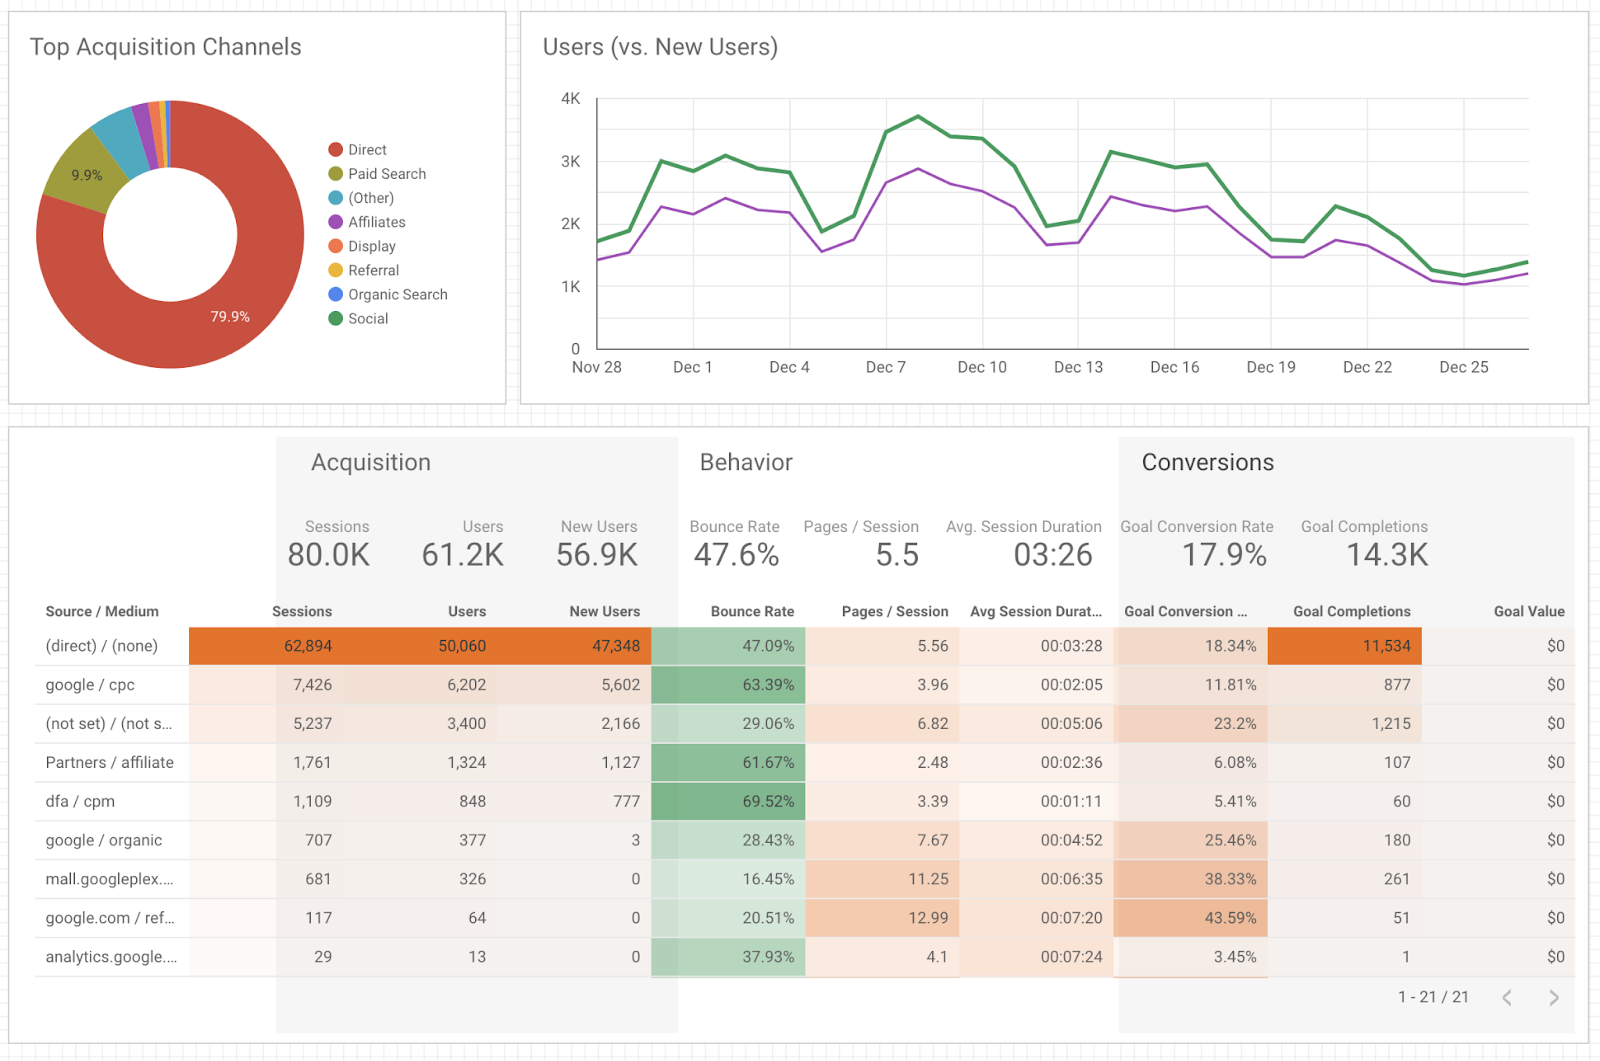
We invested time in investigating and testing the data’s potential. For example, we required a comprehensive picture of the performance across several properties that Google Analytics was tracking. I was able to see how the number of sessions changed over time for five different brands by conducting experiments.
User Testing
Our team carried out user testing after coming up with the dashboard’s initial design. We assessed the ease with which our colleagues could derive insights from the data and solicited input on any further data that would be required for improved context. To better meet the needs of the team, some teammates may highlight information that is repeated or make suggestions for how to organise or visualise the data.
Verify Your Data
In order to make sure that our data was accurate and pertinent, we worked with other teams, including engineering and data & research. For instance, our engineering lead’s insights made it clear that, although actual search terms driving users to our sites required data from Google Console, “Search Queries” in Google Analytics refers to user searches within our sites. Due to variations in how each metric is counted in GA, our data team’s guidance also stressed the significance of analysing some data metrics by “sessions” rather than “pageviews.”
Distribute It!
Lastly, we made sure our staff was properly oriented to the completed dashboard design and that it was readily available for usage in the future.
Design for Usability
Now, onto the nitty-gritty of designing an effective dashboard that not only looks good but also serves its purpose seamlessly. Here are some UX best practices to keep in mind:
Focus on Clarity and Conciseness: Keep your dashboard clutter-free and focus on displaying only the most relevant information. Remember, less is more!
Visualizations: Choose the right type of visualizations that best represent your data and make it easy for users to interpret.
Layout and Hierarchy: Organize your dashboard in a logical manner, with clear hierarchy and intuitive navigation paths.
Accessibility: Ensure your dashboard is accessible to users of all abilities, with features like alternative text for images and keyboard navigation options.
Customization: Allow users to customize their dashboard according to their preferences, such as choosing which metrics to display or adjusting the layout.
Interactivity: Make your dashboard interactive, allowing users to drill down into specific data points and explore trends and patterns.
Conclusion
And there you have it, folks – a crash course on building a data-driven UX dashboard that packs a punch. By harnessing the power of data and combining it with thoughtful design, design agencies can supercharge their decision-making process and deliver exceptional user experiences. So, what are you waiting for? It’s time to unleash the full potential of your designs with a UX data dashboard that’s tailor-made for success.